How to create Graph
After pushing Graph button in the main menu, Selection UI(user interface) is shown.
Please select one from these menu(
New/Load/Cancel) according to your purpose .
New
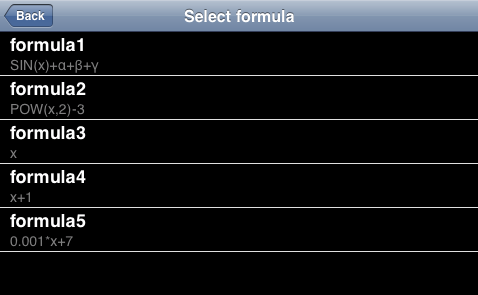
1. Select formula from the list. You can only select your created(saved) formula at Calc.
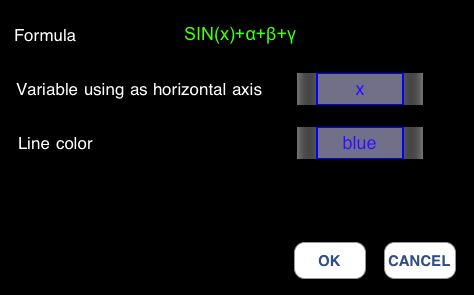
2. Select variable using as horizontal axis and line color, then push ok button.
Load
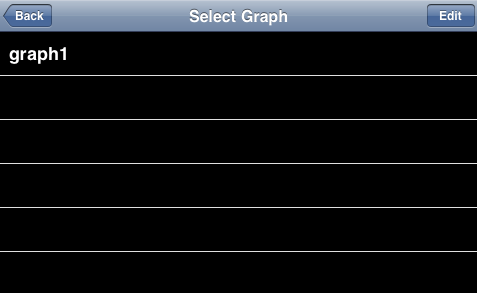
If you want to edit this, push edit button.
Cancel
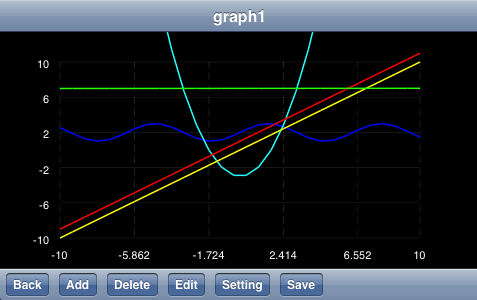
Buttons in Graph
The meaning of these buttons is as follows.
Back
Add
Delete
Edit
Setting
- You can change range of axis.
- You can change number of data for plot. The curve will smooth as this number grows.
Save
Note
This graph function has the following limitations.
It is not possible to draw in the function including the breakpoint appropriately by this graph function.
It is not possible to draw in the function including parallel asymptotic line to vertical axis appropriately by this graph function.